|
���x��С�����QС����Ӣ����Mini Program����һ�N����Ҫ���d���b����ʹ�õđ��ã������F�ˑ��á��|�ֿɼ����ĉ��룬�Ñ���һ����һ�¼��ɴ��_���á�С������һ�N�������d����ʹ�õđ��ã�Ҳ��һ... ��С�����QС����Ӣ����Mini Program����һ�N����Ҫ���d���b����ʹ�õđ��ã������F�ˑ��á��|�ֿɼ����ĉ��룬�Ñ���һ����һ�¼��ɴ��_���á�С������һ�N�������d����ʹ�õđ��ã�Ҳ��һ��T���dz��ߵĄ��£����^��������İlչ���ѽ��������µ�С�����_�l�h�����_�l�����B�� �@ƪ������Ҫ��B����С����D�����(wx-charts)�������a������һ���ą����rֵ�����dȤ��С��邃���ԅ���һ�¡���С����D�����ߣ�charts for WeChat small app ����canvas�L�ƣ��w�eС�� ֧�ֈD�����
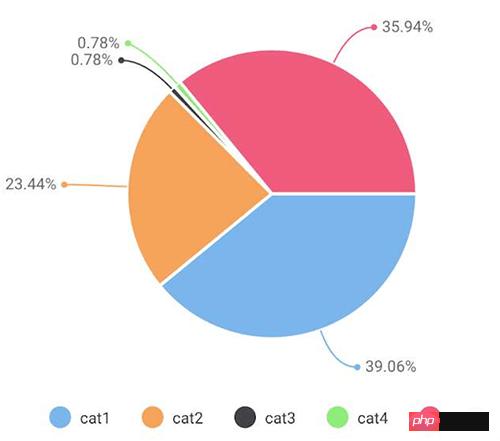
�����f�� opts Object opts.canvasId String required ��С����canvas-id opts.width Number required canvas���ȣ���λ��px opts.height Number required canvas�߶ȣ���λ��px opts.title Object (only for ring chart) opts.title.name String ���}���� opts.title.fontSize Number ���}���w��С�����x����λ��px�� opts.title.color String ���}�ɫ�����x�� opts.subtitle Object (only for ring chart) opts.subtitle.name String �����}���� opts.subtitle.fontSize Number �����}���w��С�����x����λ��px�� opts.subtitle.color String �����}�ɫ�����x�� opts.animation Boolean default true �Ƿ�Ӯ�չʾ opts.legend Boolen default true �Ƿ��@ʾ�D���·���e�Ę��R opts.type String required �D����ͣ����xֵ��pie, line, column, area, ring opts.categories Array required (D���A�h�D����Ҫ) ����e��� opts.dataLabel Boolean default true �Ƿ��ڈD�����@ʾ��������ֵ opts.dataPointShape Boolean default true �Ƿ��ڈD�����@ʾ�����c�D�Θ��R opts.xAxis Object X�S���� opts.xAxis.disableGrid Boolean default false ���L��X�S�W�� opts.yAxis Object Y�S���� opts.yAxis.format Function �Զ��xY�S�İ��@ʾ opts.yAxis.min Number Y�S��ʼֵ opts.yAxis.max Number Y�S�Kֵֹ opts.yAxis.title String Y�Stitle opts.yAxis.disabled Boolean default false ���L��Y�S opts.series Array required �����б� �����б�ÿ헽Y�����x dataItem Object dataItem.data Array required (D���A�h�D��Number) ���� dataItem.color String ����#7cb5ec ������tʹ��ϵ�yĬ�J��ɫ���� dataItem.name String �������Q dateItem.format Function �Զ��x�@ʾ�������� Example pie chart var wxCharts = require('wxcharts.js');
new wxCharts({
canvasId: 'pieCanvas',
type: 'pie',
series: [{
name: 'cat1',
data: 50,
}, {
name: 'cat2',
data: 30,
}, {
name: 'cat3',
data: 1,
}, {
name: 'cat4',
data: 1,
}, {
name: 'cat5',
data: 46,
}],
width: 360,
height: 300,
dataLabel: true
});
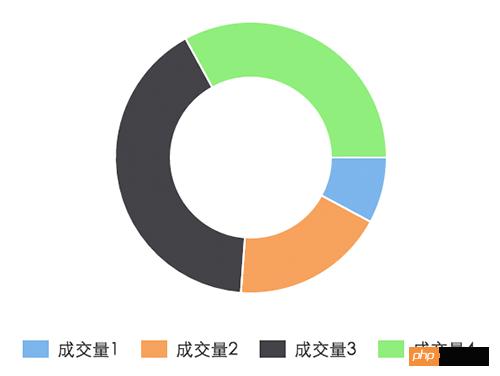
ring chart new wxCharts({
canvasId: 'ringCanvas',
type: 'ring',
series: [{
name: '�ɽ���1',
data: 15,
}, {
name: '�ɽ���2',
data: 35,
}, {
name: '�ɽ���3',
data: 78,
}, {
name: '�ɽ���4',
data: 63,
}],
width: 320,
height: 200,
dataLabel: false
});
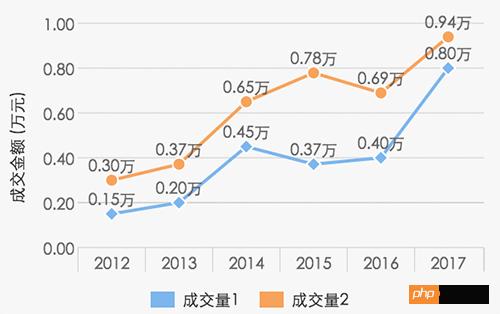
line chart new wxCharts({
canvasId: 'lineCanvas',
type: 'line',
categories: ['2012', '2013', '2014', '2015', '2016', '2017'],
series: [{
name: '�ɽ���1',
data: [0.15, 0.2, 0.45, 0.37, 0.4, 0.8],
format: function (val) {
return val.toFixed(2) + '�f';
}
}, {
name: '�ɽ���2',
data: [0.30, 0.37, 0.65, 0.78, 0.69, 0.94],
format: function (val) {
return val.toFixed(2) + '�f';
}
}],
yAxis: {
title: '�ɽ����~ (�fԪ)',
format: function (val) {
return val.toFixed(2);
},
min: 0
},
width: 320,
height: 200
});
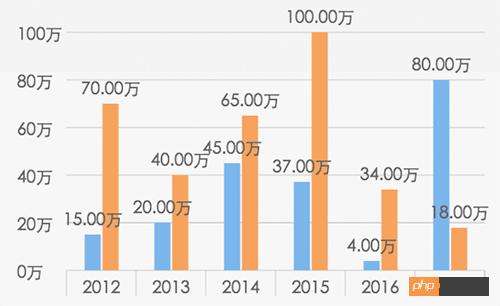
columnChart new wxCharts({
canvasId: 'columnCanvas',
type: 'column',
categories: ['2012', '2013', '2014', '2015', '2016', '2017'],
series: [{
name: '�ɽ���1',
data: [15, 20, 45, 37, 4, 80]
}, {
name: '�ɽ���2',
data: [70, 40, 65, 100, 34, 18]
}],
yAxis: {
format: function (val) {
return val + '�f';
}
},
width: 320,
height: 200
});
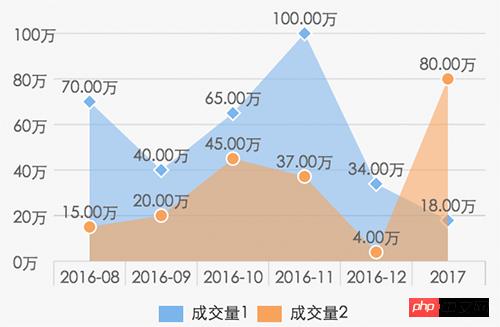
areaChart new wxCharts({
canvasId: 'areaCanvas',
type: 'area',
categories: ['2016-08', '2016-09', '2016-10', '2016-11', '2016-12', '2017'],
series: [{
name: '�ɽ���1',
data: [70, 40, 65, 100, 34, 18],
format: function (val) {
return val.toFixed(2) + '�f';
}
}, {
name: '�ɽ���2',
data: [15, 20, 45, 37, 4, 80],
format: function (val) {
return val.toFixed(2) + '�f';
}
}],
yAxis: {
format: function (val) {
return val + '�f';
}
},
width: 320,
height: 200
});
���Ͼ��DZ��ĵ�ȫ�����ݣ�ϣ������ҵČW�������������������P����Ո�PעPHP���ľW�� ���P���]�� ���Ͼ�����С����D�����(wx-charts)�Ľ�B��Ԕ�����ݣ�����Ո�Pעphp���ľW�������P���£� С������һ�N����Ҫ���d���b����ʹ�õđ��ã������F�ˑ��á��|�ֿɼ����ĉ��룬�Ñ���һ������һ�¼��ɴ��_���á� |
��ܰ��ʾ��ϲ�g��վ��Ԓ��Ո�ղ�һ�±�վ��
��վ�l����Win7������ϵ�y��Win10�������XP������ϵ�y�H�邀�ˌW���yԇʹ�ã�Ո�����d��24С�r�Ȅh�������������κ��̘I��;����t�����ؓ��Ո֧��ُ�Iܛ����ܛ����
��վ�����YԴȫ�������ھW�j�YԴ,���ַ������ę���,Ո���r֪ͨ�҂�(peng896066052@126.com),�҂������r̎��.
Copyright © 2018-2020 ����ľ�L���dվ